
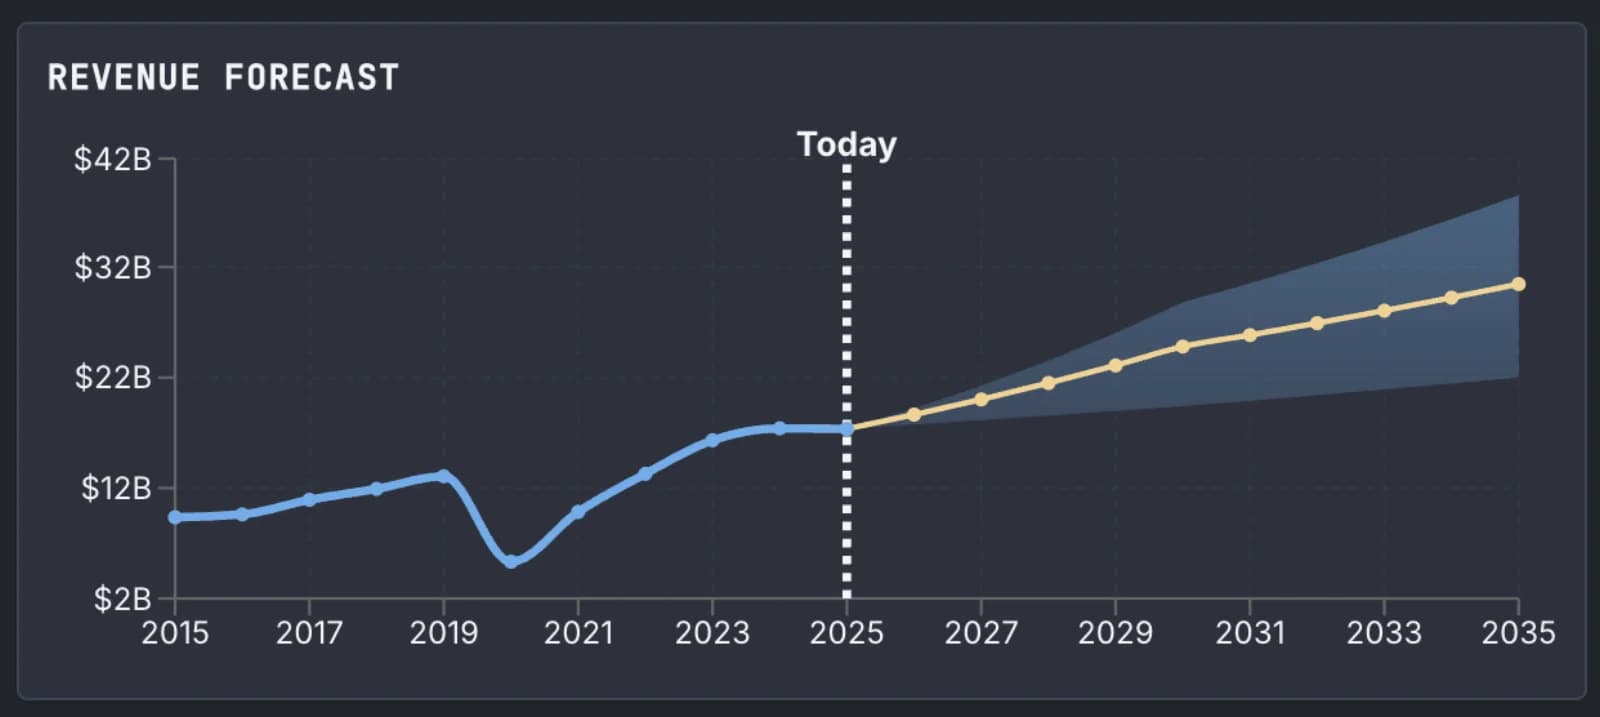
 Forecasted revenue recovery from pandemic lows to $24.6B by 2030 and $30B+ by 2035
MGM Resorts International has revenue from many sources, so it's a great case study for fundamental stock evaluation. We work out a comprehensive long-term forecast, and show how this leads to non-obvious findings, and a very different valuation than the stock market gives today.
Summary
- We present a comprehensive forecast of MGM's value over time, anchored on modeling revenue from every segment.
- We also explain our model of net margins, a core component of our discounted cash flow model, and reason through structural constraints that lead to our bear scenario
- Our forecast accounts for both high-conviction growth drivers and significant execution risks, but even wide 80% confidence intervals give a strong case that the market is mispriced according to long-term fundamentals.
The Challenge of Forecasting Gaming Conglomerates
MGM Resorts is a particularly complex forecasting challenge. Unlike a pure-play casino operator or a straightforward retail business, the company operates across multiple segments with different growth trajectories and risk profiles. Applying a single historical growth rate would obscure the critical dynamics.
The company's recent transformation makes this even harder. MGM has pursued an asset-light strategy recently, monetizing real estate holdings while simultaneously investing billions in new development projects in Osaka and Dubai. It suspended dividends in early 2023 to fund an aggressive share repurchase program that has reduced shares outstanding by 45% since 2021. Meanwhile, its BetMGM digital venture has swung from heavy losses to approaching profitability.
These structural changes mean the company operating in 2030 will look materially different from today's MGM. A sophisticated forecast must account for each segment individually.
The complete financial picture for MGM's five-year outlook encompasses revenue growth, margin recovery, and normalized capital returns:
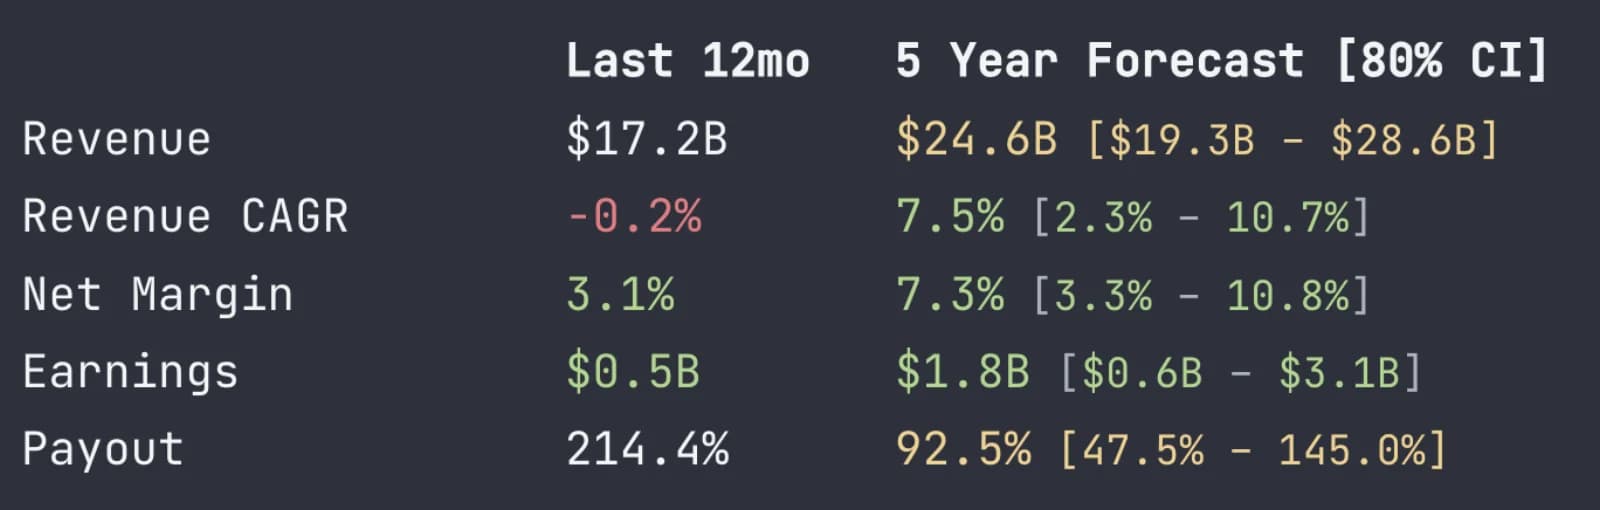 Five-year forecast projects 43% revenue growth with margin recovery to 7.3% and normalized payout ratios
A Segment-by-Segment Revenue Build
Our median 2030 revenue forecast of $24.6B begins with the 2024 baseline of $17.24B and constructs a bottoms-up view of each business component.
We model the core brick-and-mortar operations in Las Vegas and regional markets at 3.5-5.0% compound annual growth, deliberately below the company's historical 6.0% pace. This deceleration reflects regression to the mean on a $17B revenue base and visible near-term weakness. In Q2 2025, Las Vegas Strip revenues declined 4% due primarily to hotel renovations, while the broader Strip segment has shown persistent softness in midweek demand and value-oriented visitors. We assume modest recovery aided by the completion of major property renovations and new attractions like the MLB stadium.
MGM China is more dynamic. The Macau gaming market has shown robust recovery post-pandemic, and MGM China achieved record EBITDAR with a 16.6% market share in Q2 2025, posting a 9% increase in net revenues. We layer in $400M-$1.0B of incremental revenue beyond steady-state assumptions, reflecting both continued market recovery and MGM's demonstrated ability to gain share against competitors in the region.
We think the digital business is the inflection point. BetMGM has undergone a remarkable transformation from cash-burning venture to near-profitability. In the Q2 2025 investor presentation, BetMGM's EBITDA grew nearly tenfold year-over-year to $86 million, and the company raised its full-year guidance. The venture now demonstrates 66% incremental revenue flow-through, validating its unit economics. We add $800M-$2.0B in incremental consolidated revenue impact by 2030, adjusting for the joint venture structure and continued competitive intensity in U.S. online gaming markets.
Our biggest modeling challenge comes from the international development projects. They are highest-impact and highest-uncertainty, like the Osaka integrated resort, which broke ground in April 2025 with a targeted autumn 2030 opening. We think as a newly-opened property in its inaugural year, operational ramp-up will be incomplete by 2030. The treatment under equity method accounting may limit consolidated revenue recognition despite the project's scale. We conservatively assume $300-500M contribution, with significant uncertainty around the opening timing and accounting treatment.
Dubai adds another $100-400M after two years of operations, assuming construction proceeds on schedule. We probability-weight these projects for both execution risk and timing delays that have historically plagued large-scale casino developments.
The Margin Recovery Story
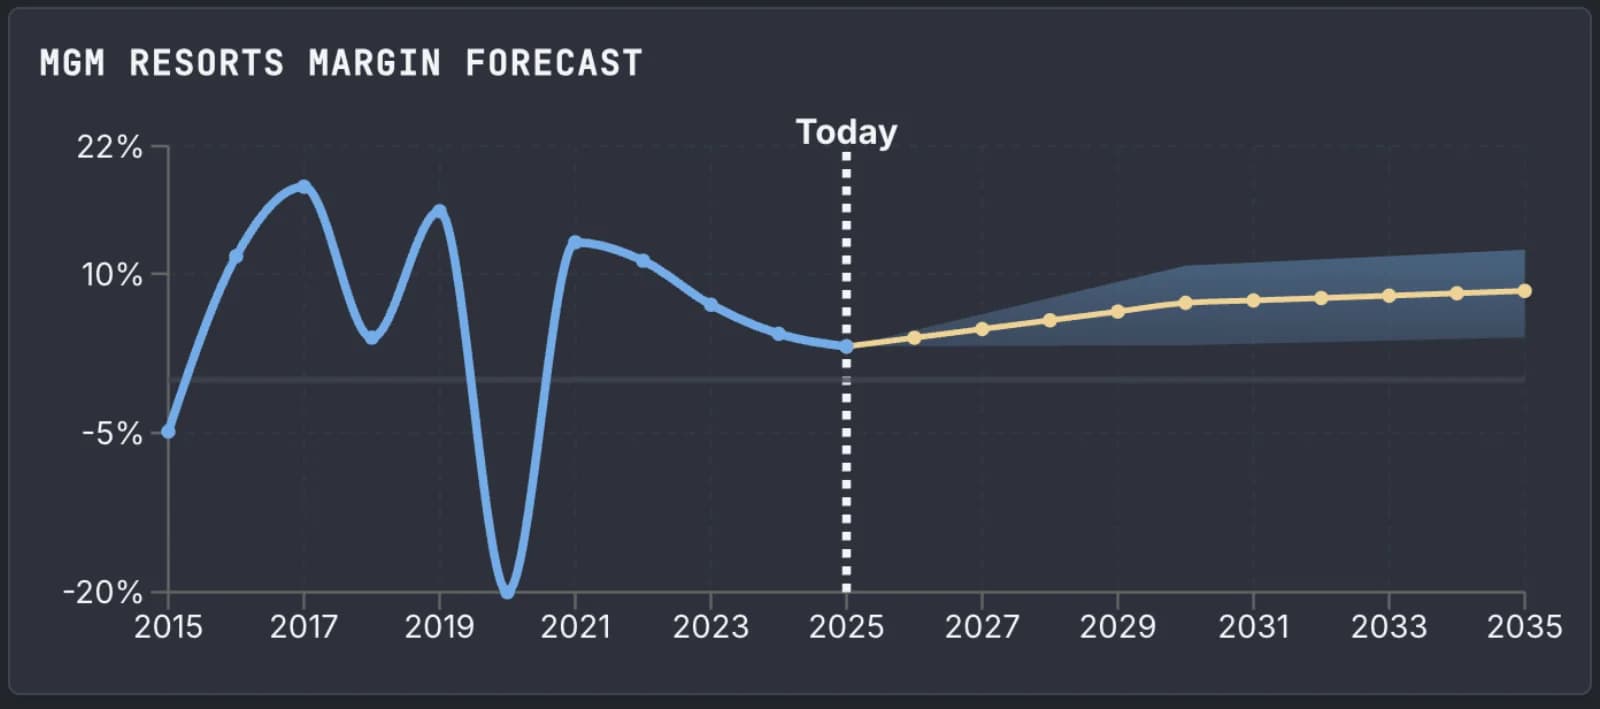 Net margins recovering from pandemic collapse but constrained below pre-2020 peaks due to structural changes in the business model
Our projected margin expansion from 3.1% to 7.3% represents a return toward historical norms rather than a transformation. Current margins are unsustainably depressed relative to both MGM's long-term average of 6.0% and direct competitors operating at 9.5%.
We think BetMGM and the Las Vegas properies support margin recovery. BetMGM's swing from losses to an estimated $400-500M EBITDA by 2030 represents a transformational change in segment profitability. An MGM investor presentation claimed MGM has also implemented a $200 million operational efficiency program, which should add 1-2 percentage points to margins as it takes full effect. The completion of major Las Vegas property renovations eliminates near-term disruption costs, while new attractions should drive higher-quality revenue mix.
But we also think structural headwinds prevent a return to pre-pandemic margin levels above 12%. The company's 2024 10-K reveals annual lease obligations totaling $1.8 billion under its asset-light model, creating significant fixed costs and operational inflexibility. New properties in Osaka and Dubai will operate at dilutive margins.
Our 7.3% median forecast sits comfortably within the gaming industry average of 7.4%, modestly above MGM's historical average, but acknowledges the company cannot return to its previous margin structure given these permanent changes to the cost base.
Accounting for Uncertainty
Like any good forecast that far our, we give wide confidence intervals to revenues, margins, and payouts. But our core finding is that, even within these bounds, a discounted cashflow model gives a much different valuation than the stock market today.
The 10th-90th percentile range for 2030 revenue spans $19.25B to $28.65B—a 48% spread, given multiple binary outcomes, like the Osaka project construction timelines, and risks in Dubai and Macau, and with BetMGM.
Macroeconomic scenarios always matter in such models, but even more so for cyclical businesses like gaming. Our forecast range attempts to capture both recession scenarios where gaming revenues contract sharply, and favorable scenarios where continued economic expansion supports premium pricing and high-roller activity.
The forecast methodology deliberately avoids the false confidence of point estimates. By explicitly modeling the range of outcomes, it provides a more honest assessment of our uncertainty even after our deep research.
The Resulting Valuation
The essential insight from this analysis is that forecasting MGM requires bottoms-up work rather than simple extrapolation. Each business segment operates under different dynamics, and several face inflection points over the forecast period.
When this is done methodically, one can construct a discounted cashflow model that is completely independent of the current stock price. Our valuation comes in dramatically higher than the current market cap. The full forecast and valuation are at stockfisher.app.